

Which sites are driving traffic to your store? Where in the world are your visitors located? How did your Black Friday, Cyber Monday marketing campaign perform last year? What are the products that your customers are looking for the most?
Surely you have many questions about your business, your customers and your marketing strategies.
Fortunately, the answers to many of those questions can be found in Shopify’s reports and statistics.
LET’S START WITH SHOPIFY ANALYTICS
Shopify Analytics is Shopify’s built-in data dashboard. It is a tool for eCommerce store owners to understand how their store performing and how to improve. Shopify Analytics has three sections: Dashboards, Reports and Live View.
Open the Shopify Analytics, let’s move to ‘Dashboard’ first.
DASHBOARD
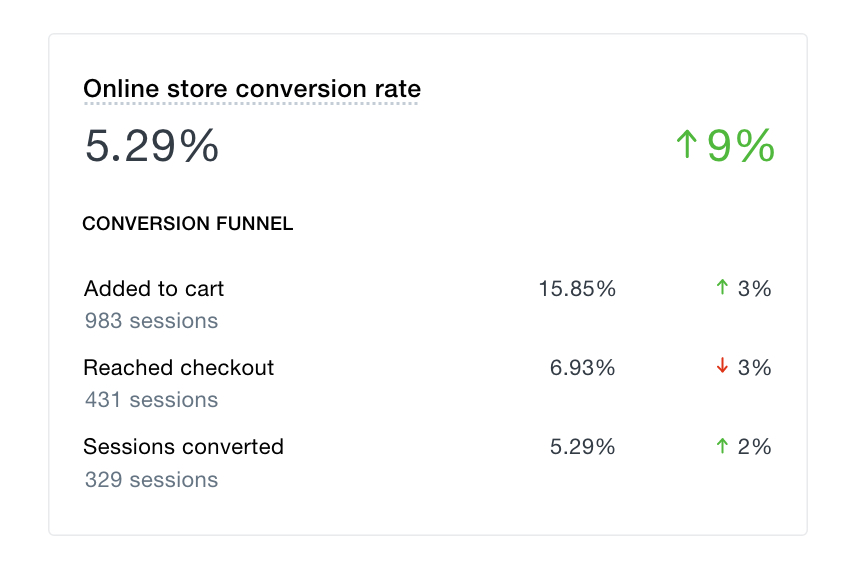
On the dashboard, you will find total sales, total orders, total sessions, conversion rate, returning customer rate, sessions by traffic source, sales by traffic source and more.

If you’re wondering where you should start your store tour because you don’t have enough time to check everything out right now, start looking at the Conversion Funnel. It shows that 26% of sessions under “Sessions converted” are increased as compared to the previous period.
OPTIMIZING YOUR SHOPIFY CHECKOUT
MOVING TO SHOPIFY REPORT
Depending on the plan you have, you will have different reports available. All users have access to the overview dashboard and finance reports. If you’re on the Basic Shopify plan or higher, you also have access to other reporting categories, namely acquisition, behaviour, and marketing.
Acquisition
Increase visitor engagement by knowing where your visitors are coming from and measuring the success of your campaigns.
This report will provide you below details:
- Sessions over time
- Sessions by referrer
- Sessions by location
Sales
Make business decisions by comparing sales across products, staff, channels, and more.
This report will provide you below details:
- Sales over time
- Sales by product
Orders
Get a sense of your store’s order volume and flow, as well as overall fulfilment performance, with orders reports.
This report will provide you below details:
- Orders over time
- Product orders and returns
- Fulfilment over time
- Fulfilment, shipping, and delivery times
Profit margin
See how products and locations contribute to the gross profit and margin for your business.
This report will provide you below details:
- Profit by product
- Profit by product variant SKU
Inventory
Track and understand the movement of your products for more efficient inventory management.
This report will provide you below details:
- Sell-through rate by product
- Days of inventory remaining
- ABC analysis by product
- Percent of inventory sold
- Average inventory sold per day
- Month-end inventory snapshot
- Month-end inventory value
Behavior
Improve your store by understanding how visitors move through your site.
This report will provide you below details:
- Online store conversion over time
- Top online store searches
- Top online store searches with no results
- Product recommendation conversions over time
- Sessions by landing page
- Sessions by device
- Online store cart analysis
- Online store speed
Customers
Gain insights into who your customers are and how they interact with your business.
This report will provide you below details:
- Customers over time
- First-time vs returning customer sales
- Customers by location
- Returning customers
- One-time customers
Finances
View your store’s finances including sales, returns, taxes, payments, and more.
This report will provide you below details:
- Finances summary
- Total sales
- Taxes
- Tips
- Payments
Marketing
Gain insights into where your online store customers are converting from.
This report will provide you below details:
- Sessions attributed to marketing
- Sales attributed to marketing
- Conversion by first interaction
- Conversion by last interaction
- Attribution model comparison
SHOPIFY LIVE VIEW: THE FINAL SECTION
The last and final section under Shopify Analytics is the ‘Live View’. It shows a real-time view of a world map. In this section, you will find out how many visitors viewing your store and from where they are coming.
CONCLUSION
Your store’s data will show you how your customers are finding your products, and how they want your store to work. Understating from Shopify Analytics reports & data not only help you to optimise your store but it will also help you make better decisions or direction you need to take.